技巧#
import matplotlib.pyplot as plt
import numpy as np
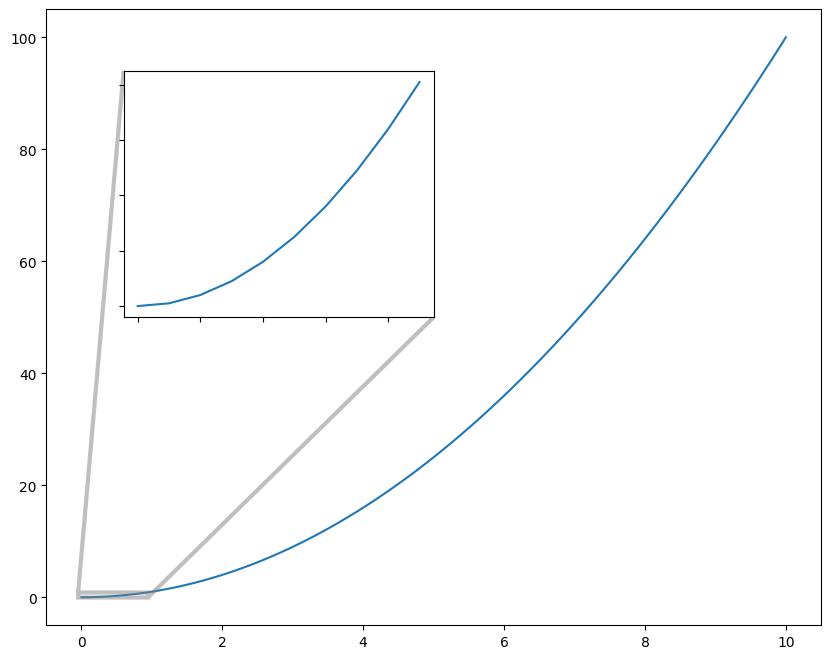
Zoom-in#
step = 0.1
x = np.arange(0, 10 + step, step)
y = x**2
_, ax = plt.subplots(figsize=[10, 8])
ax.plot(x, y)

axins = ax.inset_axes([0.1, 0.5, 0.4, 0.4])  # ty:ignore[invalid-argument-type]
axins.plot(x[:10], y[:10])

ax.indicate_inset_zoom(axins, lw=3)

axins.set_xticklabels("")
axins.set_yticklabels("")
[Text(0, -0.2, ''),
 Text(0, 0.0, ''),
 Text(0, 0.2, ''),
 Text(0, 0.4000000000000001, ''),
 Text(0, 0.6000000000000001, ''),
 Text(0, 0.8, ''),
 Text(0, 1.0000000000000002, '')]
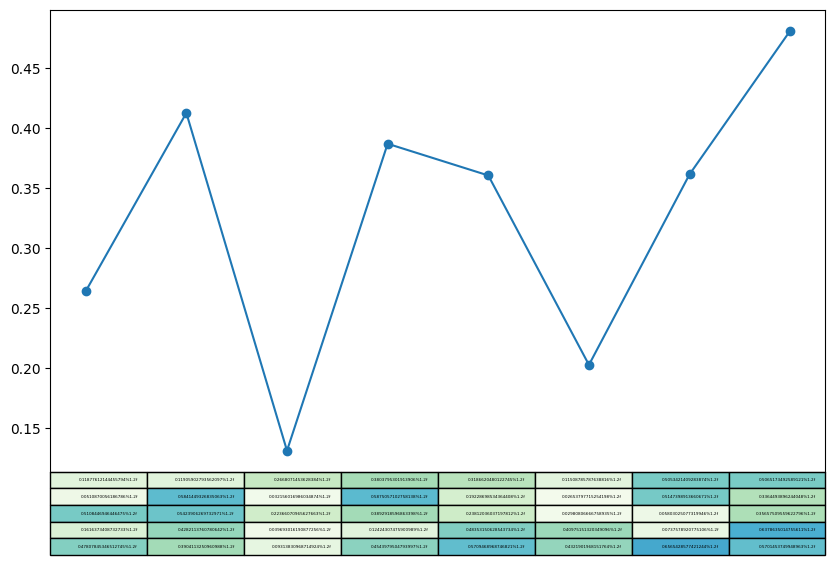
Table#
_, ax = plt.subplots(figsize=(10, 6))

x = np.random.rand(5, 8) * 0.7

ax.plot(x.mean(axis=0), "-o", label="average per column")
ax.set(xticks=[])
ax.table(
    cellText=[[f"{xxx}%1.2f" for xxx in xx] for xx in x],
    cellColours=plt.cm.GnBu(x),  # ty:ignore[unresolved-attribute]
    fontsize="large",
    loc="bottom",
)
<matplotlib.table.Table at 0x7f2f672827b0>
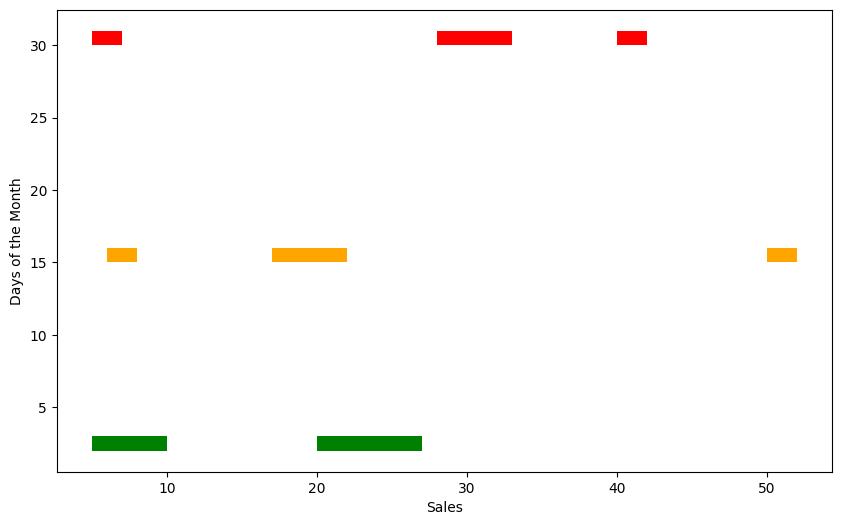
Broken Bars#
_, ax = plt.subplots(figsize=(10, 6))

x1 = [(5, 5), (20, 5), (20, 7)]
y1 = (2, 1)
ax.broken_barh(x1, y1, facecolors="green")

x2 = [(6, 2), (17, 5), (50, 2)]
y2 = (15, 1)
ax.broken_barh(x2, y2, facecolors="orange")

x3 = [(5, 2), (28, 5), (40, 2)]
y3 = (30, 1)
ax.broken_barh(x3, y3, facecolors="red")

ax.set(xlabel="Sales", ylabel="Days of the Month")
[Text(0.5, 0, 'Sales'), Text(0, 0.5, 'Days of the Month')]