偏离#
import matplotlib.pyplot as plt
import numpy as np
import polars as pl
from plotnine import *
Diverging Bar#
mtcars = pl.read_csv("data/mtcars.csv")
mtcars.head()
shape: (5, 13)
| mpg | cyl | disp | hp | drat | wt | qsec | vs | am | gear | carb | fast | cars |
|---|---|---|---|---|---|---|---|---|---|---|---|---|
| f64 | i64 | f64 | i64 | f64 | f64 | f64 | i64 | i64 | i64 | i64 | i64 | str |
| 4.582576 | 6 | 160.0 | 110 | 3.9 | 2.62 | 16.46 | 0 | 1 | 4 | 4 | 1 | "Mazda RX4" |
| 4.582576 | 6 | 160.0 | 110 | 3.9 | 2.875 | 17.02 | 0 | 1 | 4 | 4 | 1 | "Mazda RX4 Wag" |
| 4.774935 | 4 | 108.0 | 93 | 3.85 | 2.32 | 18.61 | 1 | 1 | 4 | 1 | 1 | "Datsun 710" |
| 4.626013 | 6 | 258.0 | 110 | 3.08 | 3.215 | 19.44 | 1 | 0 | 3 | 1 | 1 | "Hornet 4 Drive" |
| 4.32435 | 8 | 360.0 | 175 | 3.15 | 3.44 | 17.02 | 0 | 0 | 3 | 2 | 1 | "Hornet Sportabout" |
mtcars = mtcars.with_columns(
    mpg_z=(pl.col("mpg") - pl.col("mpg").mean()) / pl.col("mpg").std()
)
mtcars_sorted = (
    mtcars.with_columns(
        types=pl.col("mpg_z").map_batches(
            lambda x: np.where(x < 0, "red", "green"), return_dtype=pl.String
        )
    )
    .sort(by="mpg_z")
    .with_row_index()
)
mtcars_sorted.head()
shape: (5, 16)
| index | mpg | cyl | disp | hp | drat | wt | qsec | vs | am | gear | carb | fast | cars | mpg_z | types |
|---|---|---|---|---|---|---|---|---|---|---|---|---|---|---|---|
| u32 | f64 | i64 | f64 | i64 | f64 | f64 | f64 | i64 | i64 | i64 | i64 | i64 | str | f64 | str |
| 0 | 3.224903 | 8 | 472.0 | 205 | 2.93 | 5.25 | 17.98 | 0 | 0 | 3 | 4 | 0 | "Cadillac Fleetwood" | -1.829979 | "red" |
| 1 | 3.224903 | 8 | 460.0 | 215 | 3.0 | 5.424 | 17.82 | 0 | 0 | 3 | 4 | 0 | "Lincoln Continental" | -1.829979 | "red" |
| 2 | 3.646917 | 8 | 350.0 | 245 | 3.73 | 3.84 | 15.41 | 0 | 0 | 3 | 4 | 0 | "Camaro Z28" | -1.191664 | "red" |
| 3 | 3.781534 | 8 | 360.0 | 245 | 3.21 | 3.57 | 15.84 | 0 | 0 | 3 | 4 | 0 | "Duster 360" | -0.988049 | "red" |
| 4 | 3.834058 | 8 | 440.0 | 230 | 3.23 | 5.345 | 17.42 | 0 | 0 | 3 | 4 | 0 | "Chrysler Imperial" | -0.908604 | "red" |
_, ax = plt.subplots(figsize=(10, 6))

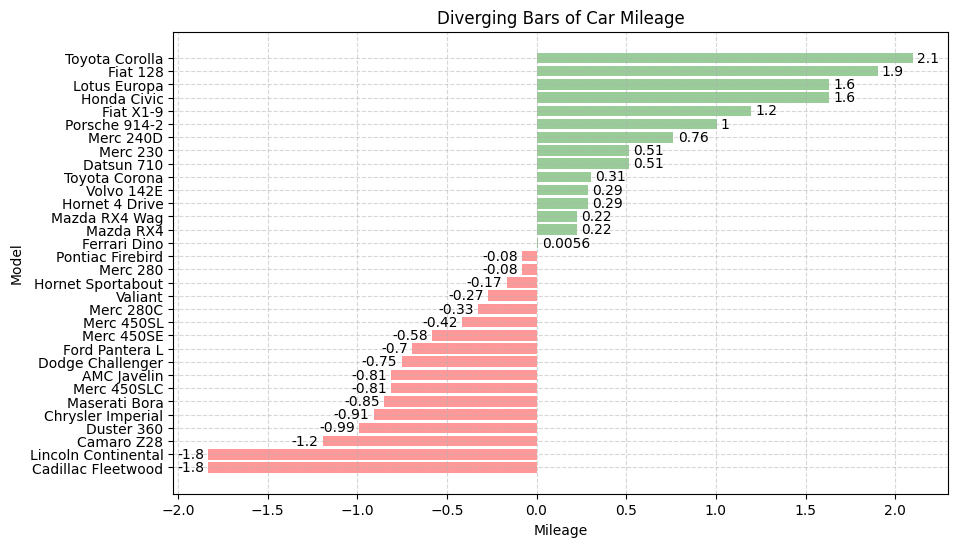
bar = ax.barh(
    y=mtcars_sorted["index"],
    width=mtcars_sorted["mpg_z"],
    color=mtcars_sorted["types"],
    alpha=0.4,
    lw=5,
)

ax.bar_label(container=bar, fmt="%0.2g", label_type="edge", padding=3)

ax.set(
    xlabel="Mileage",
    ylabel="Model",
    yticks=mtcars_sorted["index"],
    yticklabels=mtcars_sorted["cars"],
    title="Diverging Bars of Car Mileage",
)
ax.tick_params(axis="both", labelsize="medium")
ax.grid(linestyle="--", alpha=0.5)
ggplot2 version#
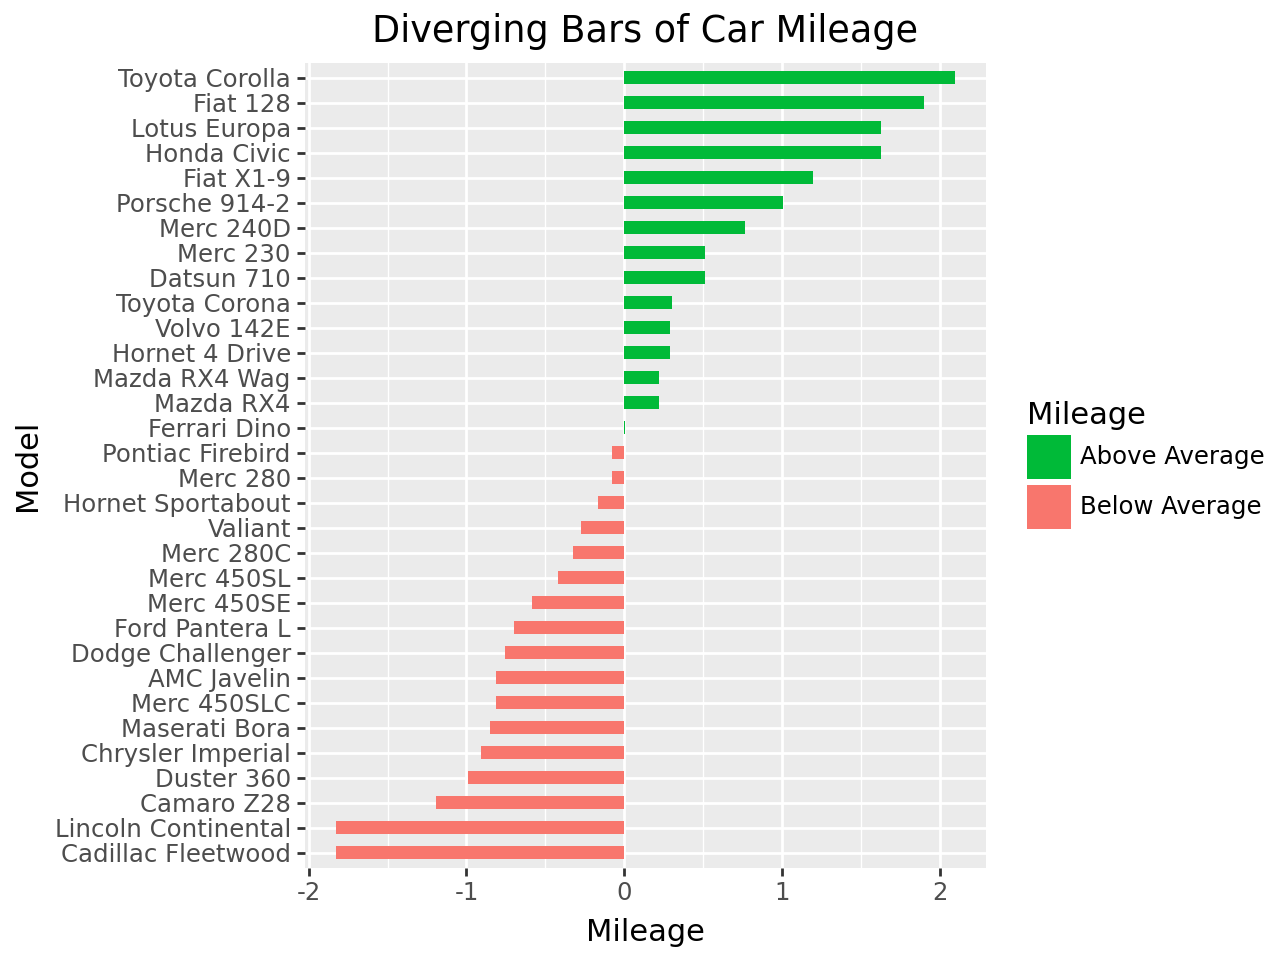
g = ggplot(mtcars_sorted, aes(x="cars", y="mpg_z", label="mpg_z"))

(
    g
    + geom_bar(aes(fill="types"), stat="identity", width=0.5)
    + scale_fill_manual(
        name="Mileage",
        labels=["Above Average", "Below Average"],
        values={"green": "#00ba38", "red": "#f8766d"},
    )
    + scale_x_discrete(limits=mtcars_sorted["cars"])
    + labs(title="Diverging Bars of Car Mileage", x="Model", y="Mileage")
    + theme(plot_title=element_text(hjust=0.5))
    + coord_flip()
)
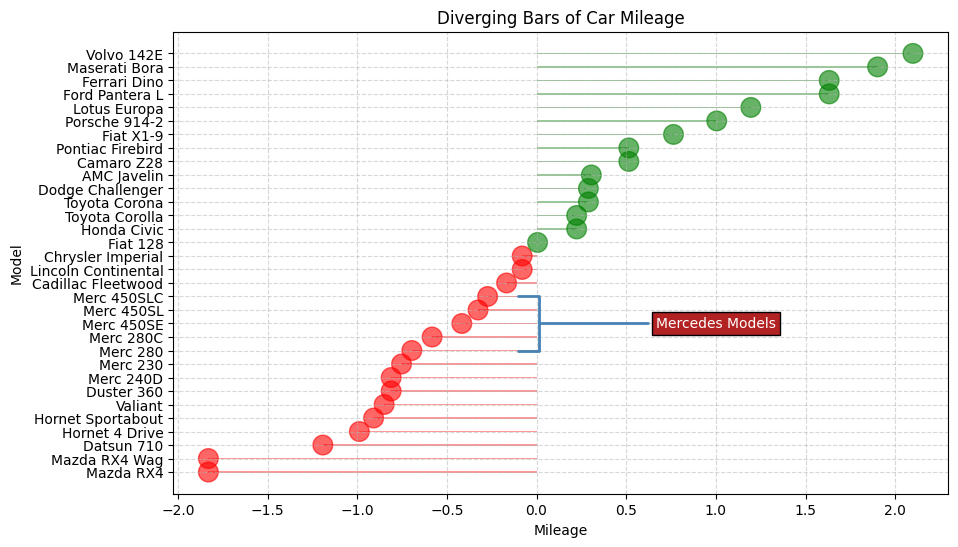
Diverging Lollipop#
_, ax = plt.subplots(figsize=(10, 6))

ax.scatter(
    mtcars_sorted["mpg_z"],
    mtcars_sorted["index"],
    color=mtcars_sorted["types"],
    s=200,
    alpha=0.6,
)

ax.barh(
    y=mtcars_sorted["index"],
    width=mtcars_sorted["mpg_z"],
    color=mtcars_sorted["types"],
    alpha=0.4,
    height=0.1,
)

ax.annotate(
    "Mercedes Models",
    xy=(0.0, 11.0),
    xytext=(1.0, 11),
    xycoords="data",
    fontsize="medium",
    ha="center",
    va="center",
    color="white",
    bbox={"boxstyle": "square", "fc": "firebrick"},
    arrowprops={
        "arrowstyle": "-[, widthB=2.0, lengthB=1.5",
        "lw": 2.0,
        "color": "steelblue",
    },
)

ax.set(
    xlabel="Mileage",
    ylabel="Model",
    yticks=mtcars.with_row_index()["index"],
    yticklabels=mtcars["cars"],
    title="Diverging Bars of Car Mileage",
)
ax.tick_params(axis="both", labelsize="medium")
ax.grid(linestyle="--", alpha=0.5)
ggplot2 version#
(
    g
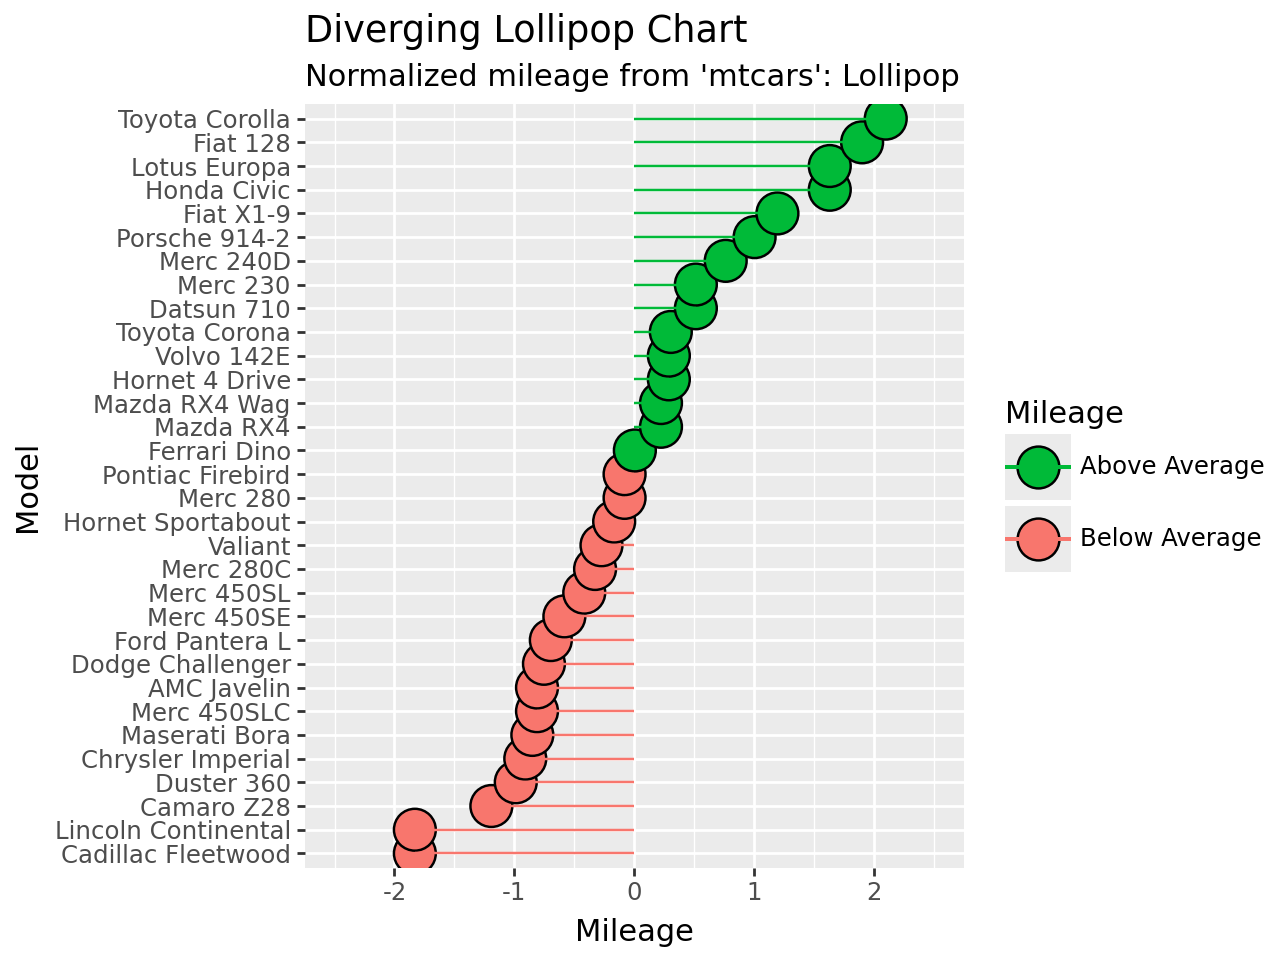
    + geom_point(aes(fill="types"), stat="identity", size=8)
    + scale_fill_manual(
        name="Mileage",
        labels=["Above Average", "Below Average"],
        values={"green": "#00ba38", "red": "#f8766d"},
    )
    + geom_segment(aes(y=0, x="cars", yend="mpg_z", xend="cars", color="types"))
    + scale_color_manual(
        name="Mileage",
        labels=["Above Average", "Below Average"],
        values={"green": "#00ba38", "red": "#f8766d"},
    )
    + scale_x_discrete(limits=mtcars_sorted["cars"])
    + labs(
        title="Diverging Lollipop Chart",
        subtitle="Normalized mileage from 'mtcars': Lollipop",
        x="Model",
        y="Mileage",
    )
    + ylim(-2.5, 2.5)
    + coord_flip()
)
Diverging Dot#
_, ax = plt.subplots(figsize=(10, 6))

scat = ax.scatter(
    mtcars_sorted["mpg_z"],
    mtcars_sorted["index"],
    s=450,
    alpha=0.6,
    color=mtcars_sorted["types"],
)

for x, y, text in zip(
    mtcars_sorted["mpg_z"], mtcars_sorted["index"], mtcars_sorted["mpg_z"]
):
    ax.text(
        x,
        y,
        round(text, 1),
        horizontalalignment="center",
        verticalalignment="center",
        fontdict={"color": "white"},
    )

ax.spines[["top", "right"]].set_visible(False)
ax.set(
    xlabel="Mileage",
    ylabel="Model",
    yticks=mtcars_sorted["index"],
    yticklabels=mtcars_sorted["cars"],
    title="Diverging Dotplot of Car Mileage",
)
ax.tick_params(axis="both", labelsize="medium")
ax.grid(linestyle="--", alpha=0.5)

(
    g
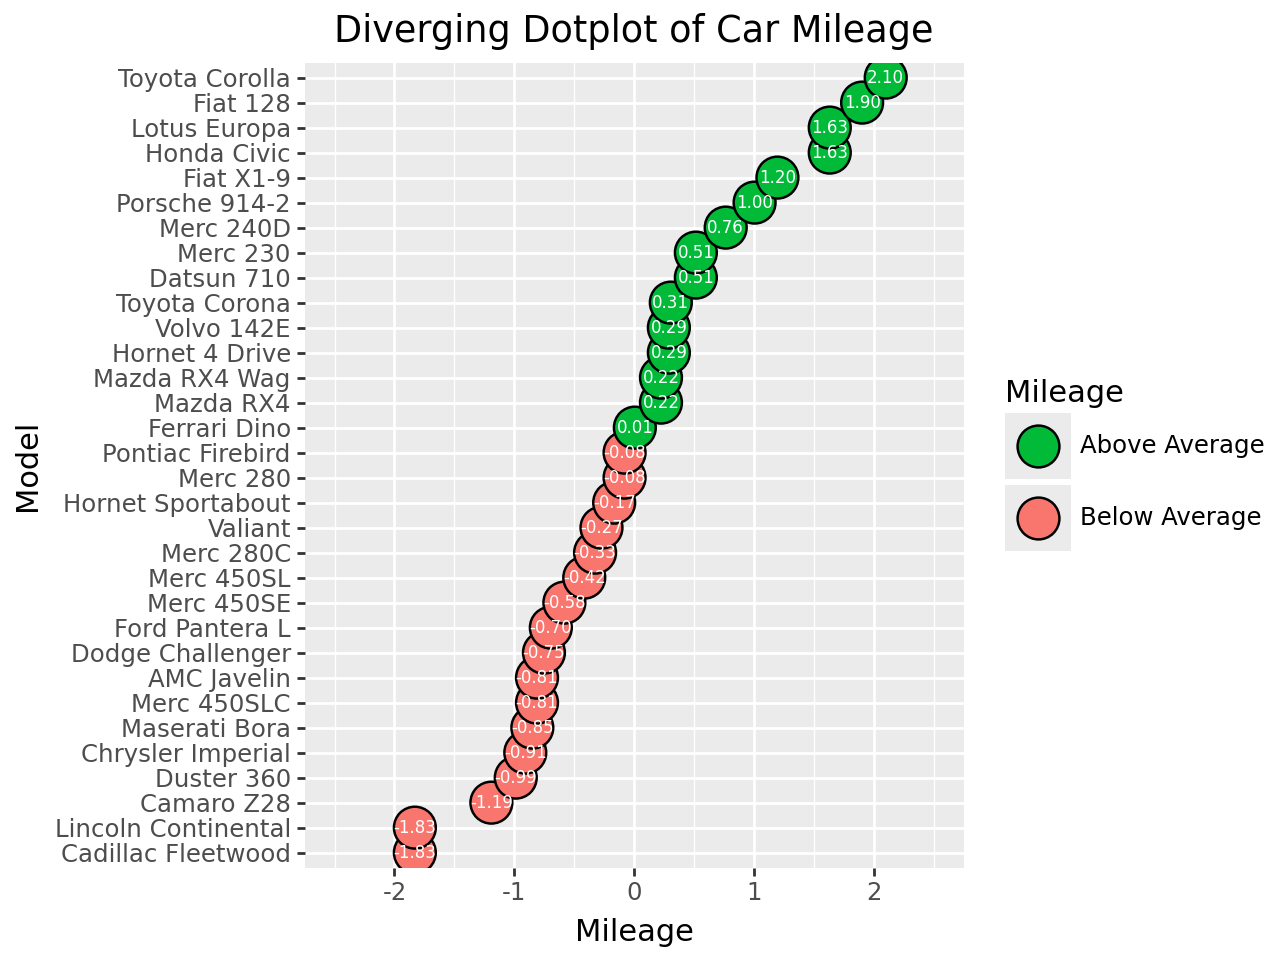
    + geom_point(aes(fill="types"), stat="identity", size=8)
    + scale_fill_manual(
        name="Mileage",
        labels=["Above Average", "Below Average"],
        values={"green": "#00ba38", "red": "#f8766d"},
    )
    + geom_text(color="white", size=6, format_string="{:.2f}")
    + labs(title="Diverging Dotplot of Car Mileage", x="Model", y="Mileage")
    + theme(plot_title=element_text(hjust=0.5))
    + scale_x_discrete(limits=mtcars_sorted["cars"])
    + ylim(-2.5, 2.5)
    + coord_flip()
)


